Foot Traffic and Mobility Data

in

Mauritius

Data Samples

Description

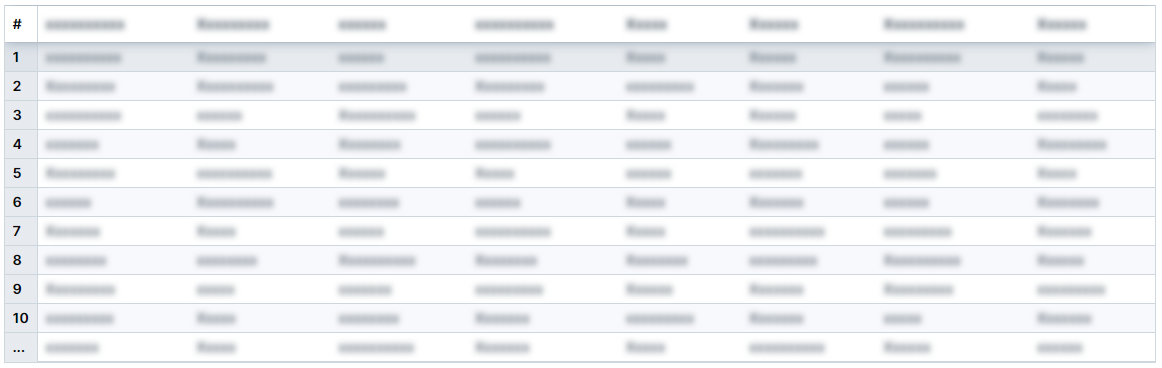
Techsalerator’s Foot Traffic and Mobility Data for Mauritius aggregates anonymized mobility signals from various sources to provide insights into movement patterns, location visits, and mobility behavior across urban centers, commercial areas, tourist spots, and rural regions throughout Mauritius.

This dataset enables organizations to analyze population movement, consumer visitation trends, and activity patterns, helping businesses, government agencies, and researchers understand where people go, how long they stay, and how foot traffic changes over time.

Top 5 Most Utilized Data Fields

  • Foot Traffic Volume: Measures the number of visits or devices detected at a specific location or point of interest (POI).
  • Location Coordinates: Provides precise latitude and longitude data, enabling mapping of mobility trends across Mauritius.
  • Dwell Time: Tracks the average duration visitors spend at a location, indicating engagement or interest levels.
  • Time of Visit: Records timestamps of visits, allowing analysis of daily, weekly, and seasonal mobility patterns.
  • Visitor Origin Data: Identifies approximate home or origin areas of visitors, supporting analysis of travel patterns and catchment areas.

Top 5 Use Cases for Foot Traffic and Mobility Data in Mauritius

  • Retail and Commercial Planning: Identify high-traffic areas for optimal store and hospitality location planning.
  • Tourism Analytics: Monitor visitor flows to beaches, resorts, and cultural landmarks to support tourism management.
  • Urban Planning and Infrastructure: Analyze congestion points and movement patterns to support transport and city planning.
  • Event Planning: Understand crowd movement and peak activity periods for festivals, markets, and public events.
  • Transport and Logistics Optimization: Evaluate commuting patterns and transit demand to improve transport systems and delivery routes.

Top 5 Locations with Notable Foot Traffic and Mobility Trends in Mauritius

  • Port Louis: The main commercial and administrative hub, with dense activity in markets, business districts, and transport areas.
  • Grand Baie: Major tourist destination with strong mobility around beaches, resorts, and retail areas.
  • Curepipe: Residential and commercial activity centered around schools, markets, and shopping zones.
  • Flic en Flac: Tourism-driven mobility with seasonal peaks around coastal resorts and beaches.
  • Mahébourg: Mix of local commerce, tourism, and port-related activity, reflecting both resident and visitor movement.

Accessing Techsalerator’s Foot Traffic and Mobility Data

  • To obtain Techsalerator’s Foot Traffic and Mobility Data for Mauritius, contact info@techsalerator.com with your requirements.
  • A customized quote will be provided based on data fields, geographic coverage, and volume of records, with datasets typically available within 24 hours.
  • Ongoing subscription access and API integrations are also available for long-term analytics, tourism monitoring, and location intelligence initiatives.

Included Data Fields

  • Foot Traffic Volume
  • Location Coordinates
  • Dwell Time
  • Time of Visit
  • Visitor Origin Data
  • Point of Interest (POI) Category (e.g., Retail, Tourism, Transport)
  • Visit Frequency
  • Device Movement Patterns

Techsalerator’s dataset provides a powerful source of mobility intelligence for businesses, government agencies, and researchers seeking to understand real-world movement trends and activity patterns across Mauritius, enabling data-driven decision-making.

Foot Traffic & Mobility Data for Mauritius

Q: How much does the Foot Traffic & Mobility Data Dataset for Mauritius cost?
The cost of the Foot Traffic & Mobility Data Dataset for Mauritius depends on factors like the number of data fields, geographic coverage, frequency of updates, and total volume of mobility records. To get an accurate quote, contact a Techsalerator Data specialist who can provide a tailored estimate for your specific needs.

Q: How complete is the coverage of the Foot Traffic & Mobility Data in Mauritius?
Techsalerator’s Foot Traffic & Mobility Data for Mauritius provides wide coverage across major cities, commercial zones, transport hubs, tourist areas, and rural regions. The dataset aggregates anonymized mobility signals to deliver a comprehensive view of movement patterns, location visits, and visitation trends throughout the country.

Q: How does Techsalerator collect this data?
Techsalerator collects Foot Traffic & Mobility Data from anonymized mobility signals derived from mobile devices, location-enabled apps, GPS data, and other reliable geospatial data providers. The data is processed and analyzed to reveal population movement trends, visitation behaviors, and mobility insights across Mauritius.

Q: Can I select specific regions or focus on particular mobility patterns within Mauritius using Techsalerator's Foot Traffic & Mobility Data?
Yes, Techsalerator allows users to filter and customize the dataset by specific regions, cities, or types of locations such as shopping centers, transport corridors, business districts, or tourist hotspots. This ensures the data meets your research, marketing, or operational needs.

Q: How do I pay for this dataset?
Secure payment options include credit cards, direct transfers, ACH (Automated Clearing House), and wire transfers. Clients can choose the method that best suits their procurement process.

Q: How do I receive the data?
Techsalerator delivers Foot Traffic & Mobility Data via FTP, SFTP, S3 bucket, or email. The data is available in JSON, CSV, TXT, or XLS formats for easy integration into your analytics platforms.

Pricing

Commercial Models

Availability

One-off purchase
Available
Data subscription (Monthly Updates)  
Available
Data subscription (Quarterly Updates)  
Available
Data subscription (Annual Updates)  
Available

Suitable Company Sizes

checkmark
Small Business
checkmark
Medium-sizedBusiness
checkmark
Enterprise

Quality

99%
Data Coverage
95%
Accuracy

Delivery

 Methods
v
SFTP
checkmark
Email
checkmark
FeedAPI
checkmark
S3 Bucket
 Format
checkmark
.json
checkmark
.csv
checkmark
.xls
checkmark
.txt
Pricing available upon request

Most popular fields

Foot Traffic and Mobility Data in Mauritius
Foot Traffic and Mobility Data in Mauritius

Description

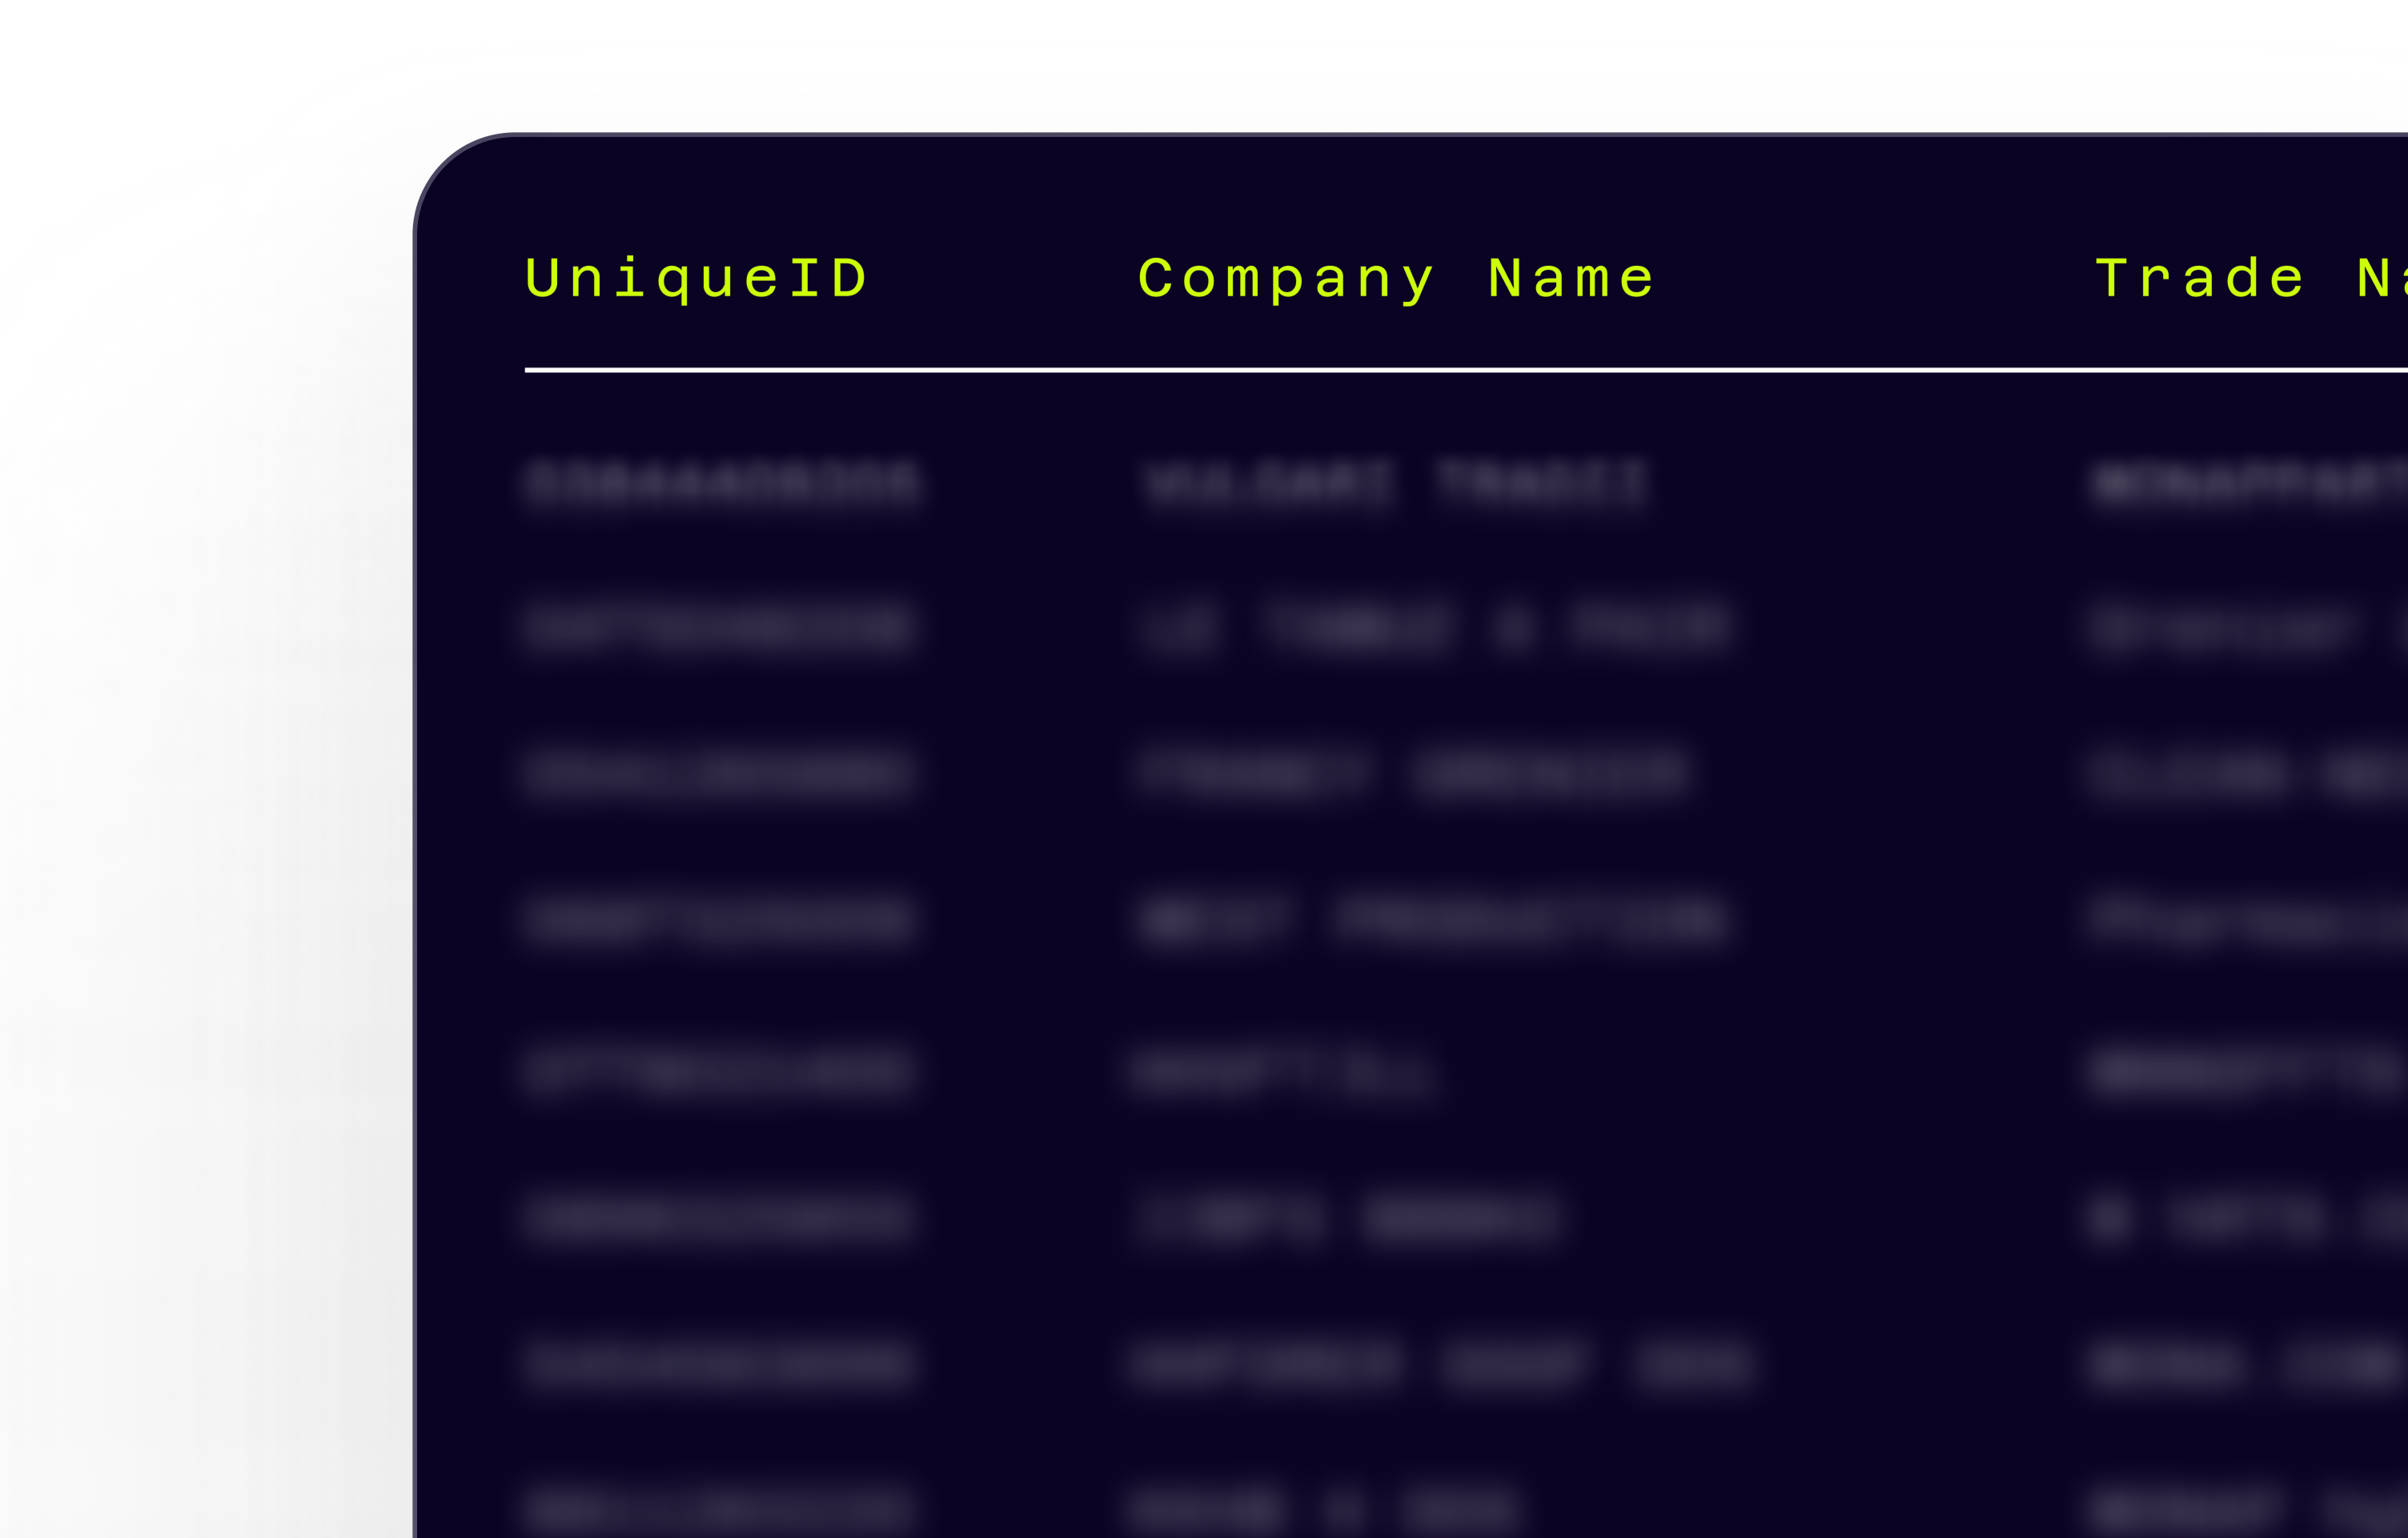
Techsalerator’s Foot Traffic and Mobility Data for Mauritius aggregates anonymized mobility signals from various sources to provide insights into movement patterns, location visits, and mobility behavior across urban centers, commercial areas, tourist spots, and rural regions throughout Mauritius.

This dataset enables organizations to analyze population movement, consumer visitation trends, and activity patterns, helping businesses, government agencies, and researchers understand where people go, how long they stay, and how foot traffic changes over time.

Top 5 Most Utilized Data Fields

  • Foot Traffic Volume: Measures the number of visits or devices detected at a specific location or point of interest (POI).
  • Location Coordinates: Provides precise latitude and longitude data, enabling mapping of mobility trends across Mauritius.
  • Dwell Time: Tracks the average duration visitors spend at a location, indicating engagement or interest levels.
  • Time of Visit: Records timestamps of visits, allowing analysis of daily, weekly, and seasonal mobility patterns.
  • Visitor Origin Data: Identifies approximate home or origin areas of visitors, supporting analysis of travel patterns and catchment areas.

Top 5 Use Cases for Foot Traffic and Mobility Data in Mauritius

  • Retail and Commercial Planning: Identify high-traffic areas for optimal store and hospitality location planning.
  • Tourism Analytics: Monitor visitor flows to beaches, resorts, and cultural landmarks to support tourism management.
  • Urban Planning and Infrastructure: Analyze congestion points and movement patterns to support transport and city planning.
  • Event Planning: Understand crowd movement and peak activity periods for festivals, markets, and public events.
  • Transport and Logistics Optimization: Evaluate commuting patterns and transit demand to improve transport systems and delivery routes.

Top 5 Locations with Notable Foot Traffic and Mobility Trends in Mauritius

  • Port Louis: The main commercial and administrative hub, with dense activity in markets, business districts, and transport areas.
  • Grand Baie: Major tourist destination with strong mobility around beaches, resorts, and retail areas.
  • Curepipe: Residential and commercial activity centered around schools, markets, and shopping zones.
  • Flic en Flac: Tourism-driven mobility with seasonal peaks around coastal resorts and beaches.
  • Mahébourg: Mix of local commerce, tourism, and port-related activity, reflecting both resident and visitor movement.

Accessing Techsalerator’s Foot Traffic and Mobility Data

  • To obtain Techsalerator’s Foot Traffic and Mobility Data for Mauritius, contact info@techsalerator.com with your requirements.
  • A customized quote will be provided based on data fields, geographic coverage, and volume of records, with datasets typically available within 24 hours.
  • Ongoing subscription access and API integrations are also available for long-term analytics, tourism monitoring, and location intelligence initiatives.

Included Data Fields

  • Foot Traffic Volume
  • Location Coordinates
  • Dwell Time
  • Time of Visit
  • Visitor Origin Data
  • Point of Interest (POI) Category (e.g., Retail, Tourism, Transport)
  • Visit Frequency
  • Device Movement Patterns

Techsalerator’s dataset provides a powerful source of mobility intelligence for businesses, government agencies, and researchers seeking to understand real-world movement trends and activity patterns across Mauritius, enabling data-driven decision-making.

Foot Traffic & Mobility Data for Mauritius

Q: How much does the Foot Traffic & Mobility Data Dataset for Mauritius cost?
The cost of the Foot Traffic & Mobility Data Dataset for Mauritius depends on factors like the number of data fields, geographic coverage, frequency of updates, and total volume of mobility records. To get an accurate quote, contact a Techsalerator Data specialist who can provide a tailored estimate for your specific needs.

Q: How complete is the coverage of the Foot Traffic & Mobility Data in Mauritius?
Techsalerator’s Foot Traffic & Mobility Data for Mauritius provides wide coverage across major cities, commercial zones, transport hubs, tourist areas, and rural regions. The dataset aggregates anonymized mobility signals to deliver a comprehensive view of movement patterns, location visits, and visitation trends throughout the country.

Q: How does Techsalerator collect this data?
Techsalerator collects Foot Traffic & Mobility Data from anonymized mobility signals derived from mobile devices, location-enabled apps, GPS data, and other reliable geospatial data providers. The data is processed and analyzed to reveal population movement trends, visitation behaviors, and mobility insights across Mauritius.

Q: Can I select specific regions or focus on particular mobility patterns within Mauritius using Techsalerator's Foot Traffic & Mobility Data?
Yes, Techsalerator allows users to filter and customize the dataset by specific regions, cities, or types of locations such as shopping centers, transport corridors, business districts, or tourist hotspots. This ensures the data meets your research, marketing, or operational needs.

Q: How do I pay for this dataset?
Secure payment options include credit cards, direct transfers, ACH (Automated Clearing House), and wire transfers. Clients can choose the method that best suits their procurement process.

Q: How do I receive the data?
Techsalerator delivers Foot Traffic & Mobility Data via FTP, SFTP, S3 bucket, or email. The data is available in JSON, CSV, TXT, or XLS formats for easy integration into your analytics platforms.

Pricing

Commercial Models

Availability

One-off purchase
Available
Data subscription (Monthly Updates)
Available
Data subscription (Quarterly Updates)
Available
Data subscription (Annual Updates)  
Available
Suitable Company Sizes
checkmark
Small Business
checkmark
Medium-sizedBusiness
checkmark
Enterprise
Quality
99%
Data Coverage
95%
Accuracy
Delivery
Methods
checkmark
SFTP
checkmark
Email
checkmark
FeedAPI
checkmark
S3 Bucket
Format
checkmark
.json
checkmark
.csv
checkmark
.xls
checkmark
.txt
Pricing available upon request
Most popular fields
What types of data does Techsalerator provide?
Our datasets cover 195 countries — every major global market — with data sourced locally to maintain accuracy, freshness, and relevance. Coverage varies by category and dataset; specific country coverage is documented on every dataset detail page.
What are the four data pillars?
Our datasets cover 195 countries — every major global market — with data sourced locally to maintain accuracy, freshness, and relevance. Coverage varies by category and dataset; specific country coverage is documented on every dataset detail page.
In which countries is Techsalerator's data available?
Our datasets cover 195 countries — every major global market — with data sourced locally to maintain accuracy, freshness, and relevance. Coverage varies by category and dataset; specific country coverage is documented on every dataset detail page.
How does Techsalerator ensure data quality?
Our datasets cover 195 countries — every major global market — with data sourced locally to maintain accuracy, freshness, and relevance. Coverage varies by category and dataset; specific country coverage is documented on every dataset detail page.
How frequently is the data updated?
Our datasets cover 195 countries — every major global market — with data sourced locally to maintain accuracy, freshness, and relevance. Coverage varies by category and dataset; specific country coverage is documented on every dataset detail page.
What types of data does Techsalerator provide?
Our datasets cover 195 countries — every major global market — with data sourced locally to maintain accuracy, freshness, and relevance. Coverage varies by category and dataset; specific country coverage is documented on every dataset detail page.
What are the four data pillars?
Our datasets cover 195 countries — every major global market — with data sourced locally to maintain accuracy, freshness, and relevance. Coverage varies by category and dataset; specific country coverage is documented on every dataset detail page.
In which countries is Techsalerator's data available?
Our datasets cover 195 countries — every major global market — with data sourced locally to maintain accuracy, freshness, and relevance. Coverage varies by category and dataset; specific country coverage is documented on every dataset detail page.
How does Techsalerator ensure data quality?
Our datasets cover 195 countries — every major global market — with data sourced locally to maintain accuracy, freshness, and relevance. Coverage varies by category and dataset; specific country coverage is documented on every dataset detail page.
How frequently is the data updated?
Our datasets cover 195 countries — every major global market — with data sourced locally to maintain accuracy, freshness, and relevance. Coverage varies by category and dataset; specific country coverage is documented on every dataset detail page.
What types of data does Techsalerator provide?
Our datasets cover 195 countries — every major global market — with data sourced locally to maintain accuracy, freshness, and relevance. Coverage varies by category and dataset; specific country coverage is documented on every dataset detail page.
What are the four data pillars?
Our datasets cover 195 countries — every major global market — with data sourced locally to maintain accuracy, freshness, and relevance. Coverage varies by category and dataset; specific country coverage is documented on every dataset detail page.
In which countries is Techsalerator's data available?
Our datasets cover 195 countries — every major global market — with data sourced locally to maintain accuracy, freshness, and relevance. Coverage varies by category and dataset; specific country coverage is documented on every dataset detail page.
How does Techsalerator ensure data quality?
Our datasets cover 195 countries — every major global market — with data sourced locally to maintain accuracy, freshness, and relevance. Coverage varies by category and dataset; specific country coverage is documented on every dataset detail page.
How frequently is the data updated?
Our datasets cover 195 countries — every major global market — with data sourced locally to maintain accuracy, freshness, and relevance. Coverage varies by category and dataset; specific country coverage is documented on every dataset detail page.
Commercial Models
Availability
One-off purchase
Data subscription (Monthly Updates)
Data subscription (Quarterly Updates)
Data subscription (Annual Updates)
Small Business
Medium-sizedBusiness
Enterprise
Data Coverage
85%
Accuracy
85%
Methods
SFTP
Email
FeedAPI
S3 Bucket
Format
.json
.csv
.xls
.txt